
Document Type : Research Paper
INTRODUCTION
Inelastic deformation of polymers generally occurs through chain sliding and flow, and on the nanometric scale, polymers are more likely to diffuse through the nanoparticle either with sliding or rearrangement. The considerable ability of one additive to enhance the properties of a polymer matrix can be explained on the basis of the large surface area of that compound [1-5]. Extrusion and solvent-casting are established techniques for the preparation of nanocomposites. The rest time to evaporate the solvent can be reduced by employing a volatile solvent or by pre-melting the polymer. However, when the viscosity of the matrix increases after a certain time, the rotational motion of the iron oxide-particle-filled composite is affected and the melt process becomes difficult. In a hybrid system, iron oxide is firstly grafted with vinyl-functionalized silane to provide a coupling agent between polyvinyl acetate (PVA) matrix and insoluble iron oxide in alcohol. Polyvinyl acetate is converted to polyvinyl alcohol (PVA) suitable for melt processing [6-13].
Polyvinyl alcohol (PVA) is a water-soluble, non-toxic, biodegradable, synthetic polymer with a simple structure, excellent biocompatibility, and high economic efficiency. It also exhibits unique properties such as flexibility, film formation, strong adhesion, gas barrier, and antibacterial ability. PVA is widely used in the electronics industry, textiles, papermaking, agriculture, medicine and biomedical applications, sealants and adhesives, coatings, food packaging, and materials such as lubricants, emulsifiers, and thickeners. Polyvinyl alcohol is produced by hydrolysis and represents the largest group of vinyl polymers commercially produced worldwide. Depending on the extent of hydrolysis, polyvinyl alcohol is classified into several grades [14-17].
Alumina nanoparticles, Al2O3 NPs or gamma-Al2O3 NPs, belong to the area of nanotechnology which is currently one of the most actively developed fields of research and application. They are solid materials built from two or more constituents, among which Al and O atoms are present. Not only are they one of the most popular nanoparticle systems regarded in scientific literature, but they also exhibit unique properties that arise as a result of their extremely small sizes and high specific surface area. They can show very high surface reactivity; therefore, functionalization of the surface is a common practice. Zeta potential measurements indicate the possibility of particle disaggregation in a liquid. Al2O3 NPs effectively facilitate catalytic reactions in environments that range from high vacuum to the presence of aggressive chemicals used in the petrochemical industry, which is an important constraint in chemical synthesis. Al2O3 NPs have a wide range of applications. They are used as catalysts and catalyst supports for various reactions, for instance in exhaust gas treatment in the automotive industry, synthesis of carbon black, or as catalysts for fast conversion of aliphatic alcohols into hydrocarbons. They can either act as carriers of active metal nanoparticles or as active catalysts in themselves. Applications in heterogeneous catalysis for energy conversion present another noteworthy opportunity. Al2O3 NPs are often applied as additives in a wide range of electronic components and coatings to enhance their physical and chemical properties, for instance as dielectric materials, thermal management materials, and reliability enhancement materials. When applied as dielectric materials in electronic components, the influence of Al2O3 NPs has been shown to improve dielectric properties as well as thermal conductivity, and thus reliability. Al2O3 NPs can also serve as antimicrobials, drug carriers, bone repair materials, and antireflective coatings [18]. Alumina exhibits excellent dielectric properties and retains reliable performance under extreme conditions.
As a result, Al2O3 nanoparticles are increasingly exploited in electronic components and substrates to enhance device performance and reliability. The use of Al2O3 as a dielectric or gate insulator improves the performance of Si-based field-impact transistors, metal-oxide-semiconductor capacitors, complementary metal-oxide-semiconductor (CMOS) technology [19], and these dielectric films can be easily integrated with organic semiconductors such as pentacene, and naphthalene diimide. Furthermore, the use of Al2O3 nanoparticles as a bulking agent in organic semiconductor formulations allows the optimization of the dielectric constant and charge transport, improving the electrical performance of devices based on organic-inorganic mixtures or polymer systems [20]. Additionally, Al2O3 films enable the integration of dielectrics with organic semiconductors in organic light-emitting diodes; such Al2O3 films can be deposited on different substrate materials and semiconductors containing metals, thus facilitating the production of hybrid organic-photonic devices [21].
MATERIALS AND METHODS
Materials
Polyvinyl alcohol (average molecular weight ~85,000 g/mol) and Al₂O₃ nanoparticles were used as received.
Film Preparation
a) PVA dissolved by distilled water under magnetic stirring at 75°C even complete, b) dissolution. Al₂O₃ nanoparticles were ultrasonically dispersed for 30 minutes to minimize c) agglomeration the nanoparticle suspension was gradually introduced with PVA, d) sol at 2, 4, 6 wt.% concentrations.
The mix was stirred for 1 hour and flow in Petri dishes. Films were dried at room temperature for 24 hours. The average thickness was approximately 105 μm as it is clear in Table 1.
Statistical Analysis
All measurements were conducted in triplicate. Reported values represent mean ± standard deviation. Statistical significance was evaluated using one-way ANOVA (p < 0.05).
RESULTS AND DISCUSSION
Structural Analysis (XRD)
Pure PVA appear a wide diffraction at (2θ ≈ 20°), confirming its semi-crystalline nature. Upon Al₂O₃ incorporation, additional diffraction peaks corresponding to orthorhombic Al₂O₃ were observed.
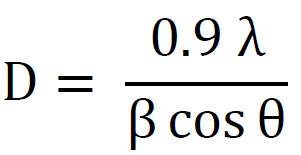
Where β is the full width of the observed diffraction at half of the maximum intensity measured in radians, θ is the Bragg’s angle and λ is X-ray wavelength, D is crystalline size measured in nm.
The calculated crystallite size was found to be reducing from 58.78nm to 36.1 nm with increasing nanoparticle loading, indicating nucleation-induced structural ordering within the polymer matrix as shown in the Table 3.
The XRD patterns were used to determine the crystallographic structure of PVA polymer and its nanocomposite films. The nanocomposites had varying ratios (2, 4, and 6 wt.%) of Al2O3 NPs. The purpose of this analysis was to identify the structure of the polymer nanocomposites at room temperature, as depicted in Fig. 1a. The figure shows that the PVA displays broad diffraction peaks at 2θ = 20.086° (strong), which indicate its amorphous nature [24]. The nanocomposites with high Al2O3 loading (6 wt.%) showed pronounced XRD peaks at 11.732o, 19.360o, 25.535o, 34.978o, 37.521o, 43.151o, 52.413o,57.498°, 66.578°, 67.850° corresponding to the miller indices of (020), (110), (130), (112), (112) (151), (242), (332), (441), and (114)). The peaks were indexed with Powder X software and contrast with the standard JCPDS card file No. 37-1463 (space group number 63) which the formation of Al2O3in Orthorhombic crystal system (a = 6.618 A°, b = 11.944A°, c = 5.724 Å°) [25]. From the Fig. 1 down of the nanocomposites, it is recognized that Al2O3 NPs at (6 wt.%) take effect on the structural characteristics of PVA.
Fourier Transformation Infrared Ray Spectroscopy (FTIR)
The spectrometer (FTIR) is used in the analysis of a board range of materials such as thin films and powders. It provides information both for mixture composition and polymer-polymer reactions using those vibrational modes attributed to free and hydrogen hydroxyl and carbonyl groups. FTIR spectra of PVA-Al2O3 nanocomposites with different doped ratios of Al2O3 nanoparticles are Record measurements in the spectrum range 400 – 4000 cm- 1. FTIR spectroscopy of PVA-Al2O3 nanocomposite films are shown in Fig. 2a. This film exhibits peaks at 3417.86, 2931.80, 1741.72, 1637.56,1620.21, 1544.98, 1512.19, 613.36, 420.48 cm-1 It is assigned to links O-H, C-H, C=O stretching’s, bending of CH2, C-O stretching, CH2 rocking, CH2 stretching and O-H wagging, respectively [24]. The O-H stretching, has the most characteristic alcohol bonds and is within the spectrum 3400 cm-1. The band returns to the band around 1415 cm -1 to the curvature the CH3 bond and the bands around it 2900 cm-1 correspond to CH2 asymmetric stretching. The range at 916.15 cm-1 is due to the syntenic structure and is caused by the CH2 vibration. Referred to PVA crystal and around 1750 cm-1 of the carbonyl that results from the absorption of the remainder of the acetate during the period of manufacture of PVA by the hydrolysis of polyvinyl acetate. The band at 1330 cm-1 was assigned to the combination frequency of CH+OH. The peaks at 1649 cm-1 have been assigned to the C=C stretching mode. The Fig. 2a shows the FTIR spectra of PVA while Figs. 2b-d show the FTIR spectra of PVA-Al2O3 nanocomposites Changing the FTIR spectrum in range 1600 to 3400 cm-1 shows that the product of the polymer chains corresponds to the O-H bond stretching, and the C-H bond stretching [26]. By the addition of Al2O3 nanoparticles to polymer blends, two significant changes are observed. There are slight changes in the intensity of absorption and in the vibrational bands, this indicates decoupling between the corresponding vibrations due to interaction between Al2O3 nanoparticles and PVA [27].
Energy-Dispersive Spectrometer (EDS).
Energy Dispersive X-ray Spectroscopy (EDS), carried out along SEM, because used to analyze the basic composition of the synthesized nanocomposites. In the EDS spectrum of PVA/Al2O3 (Fig. 3), the characteristic peaks of carbon (C) and oxygen (O) are attributed to the PVA polymer matrix, where carbon originates from the polymer backbone and oxygen arises from both the polymer’s functional groups (–OH and C=O) and the metal oxide nanoparticles. The clear signals of Al confirm the successful incorporation of Al2O3 within the polymeric structure [28]. And (EDX) confirmed the presence of Al and O elements without contamination.
Field Emission Scanning Electron Microscope (FESEM)
The surface morphology of PVA/Al2O3 nanocomposites with varying concentrations. is shown in Fig. 4 using Scanning Electron Microscopy (SEM). Fig. 4a refers to the SEM micrograph of a pure PVA polymer, illustrating its smooth and homogeneous surface morphology, without the presence of nanoparticles. This baseline morphology serves as a reference for comparing the changes induced by the incorporation of metal oxide nanoparticles in subsequent nanocomposite samples [29].
By increasing concentration of Al2O3 nanoparticles in the PVA matrix, the SEM images demonstrate a transition from a relatively uniform dispersion at lower concentrations (2–4 wt.%) to more aggregated structures and rougher surfaces at higher loading (6 wt.%). This morphological evolution is attributed to the increased particle–particle interactions, which may enhance or hinder the electrical and sensing properties depending on the extent of agglomeration [30].
At 6 wt.% loading of Al2O3 nanoparticles, the SEM image expose a relatively homogeneous distribution of nanoparticles throughout the polymer matrix with moderate surface roughness. The image shows the beginning of particle aggregation, but without severe agglomeration, indicating a partially balanced dispersion. This concentration offers an optimized morphology where the nanoparticles are sufficiently abundant to provide enhanced interfacial interaction and active sites. Such morphology is favorable for improving the electrical and biosensing properties of the nanocomposite due to effective charge transfer pathways and accessible surface area [31,32].
Optical Properties
Uv- Vis and Band Gap
The effect of varying concentrations of PVA on the optical properties of Al₂O₃ nanoparticles (NPs) was systematically investigated using UV–Vis spectroscopy over the wavelength range of 190–790 nm at room temperature. As illustrated in Fig. 5, all samples exhibit a prominent absorption edge around 220 nm,which corresponds to the electronic transition from the valence band to the conduction band.
A noticeable decrease in absorbance intensity was observed with increasing PVA concentration, accompanied by a slight blue shift toward lower wavelengths in the UV region. This shift can be attributed to changes in the electronic structure of the nanoparticles, particularly variations in the band gap energy. Typically, a shift toward lower wavelengths indicates an increase in band gap energy; however, this behavior may also be.influenced by particle dispersion and interaction with the polymer matrix [33,34].
The extinction coefficient (k) was calculated using the Eq. 2:
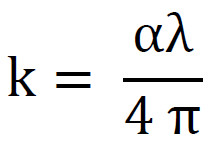
where α is the absorbance and λ is the wavelength. The plot of extinction coefficient versus photon energy (Fig. 6) shows a linear region, which was extrapolated to determine the optical band gap. The results indicate that the optical parameters are strongly dependent on nanoparticle concentration, consistent with structural findings obtained from XRD and TEM analyses
From a physical perspective, increasing particle size generally leads to a reduction in bandgap energy due to decreased quantum confinement effects. As particle size increases, the number of atoms per particle also increases, enhancing electron–ion core interactions, which in turn reduces the energy separation between the valence and conduction bands
To further identify the nature of electronic transitions, the Mott–Davis model [35] was applied Eq. 3.

where A is a constant, hυ is the photon energy, and Eg is the optical band gap. The exponent determines the type of transition. By analyzing the plots for different values of the best linear fit was obtained for indicating that the dominant transition in Al₂O₃ NPs is a direct allowed transition. Moreover, the optical band gap was found to decrease from 4.8 eV (pure PVA) to 4.1 eV at 6 wt.% Al₂O₃. This reduction can be explained by several factors: 1- Formation of localized defect states within the band structure, 2- Enhanced interfacial polarization between polymer and nanoparticles, 3- Structural rearrangements in the polymer matrix.
These factors introduce intermediate energy levels within the forbidden gap, facilitating electronic transitions at lower energies. The obtained band gap values are in good agreement with previously reported studies, confirming the reliability of the experimental approach and supporting the proposed physical interpretation [33-38].
Photoluminescence study
PL spectra showed a prominent emission peak centered at ~485 nm in the blue region. This emission an attributed to defect-related states, particularly oxygen vacancies in Al₂O₃ nanoparticles and interfacial trap states within the nanocomposite structure. The emission intensity varied with nanoparticle concentration, indicating modified recombination dynamics and defect density as shown in Fig. 8 [39- 42].
CONCLUSION
Al₂O₃-reinforced PVA nanocomposites were successfully fabricated using a solvent casting technique. Structural analysis demonstrated enhanced crystallinity with increasing nanoparticle loading. Optical measurements revealed tunable band gap behavior and defect-mediated blue emission. The results confirm that controlled incorporation of Al₂O₃ nanoparticles effectively modifies the structural ordering and optical properties of PVA films, highlighting their potential for dielectric layers, optical coatings, and optoelectronic applications.
CONFLICT OF INTEREST
The authors declare that there is no conflict of interests regarding the publication of this manuscript.
