
Document Type : Research Paper
INTRODUCTION
Synthetic dyes are used in large amounts by the textile, paper and leather industries, and part of them ends up in wastewater. Even at low concentration they colour the water, reduce light penetration and can be toxic to aquatic organisms and to people [1,2]. Auramine O (AO) is a yellow cationic diarylmethane dye. It is used for paper and textiles, and it has also turned up as an illegal food colourant [3]. A recent zebrafish study linked AO exposure to liver injury [4].
Adsorption is a simple way to remove such dyes. For AO the adsorbents tested include surfactant-modified activated carbon [5], ZnFe2O4 nanoparticles [6], alginate-coated iron oxide [7] and plant biomass [8,9]. Polysaccharide hydrogels are attractive because they swell in water and carry many ionisable groups [10]. Gels of sodium alginate (SA) and poly(acrylic acid) (PAA) are typical examples [11] and have been used for methylene blue [12], methylene green [13], azure B [14] and rose bengal [15].
Plant extracts can add further binding groups. Phytochemicals cross-linked into alginate beads gave an effective adsorbent for methylene blue [16], and dextran cryogels that contained a polyphenolic bark extract took up more dye than the plain cryogels [17]. A graft SA hydrogel filled with Ricinus communis has also been described [18]. Lawsonia inermis (henna) leaves contain lawsone (2-hydroxy-1,4-naphthoquinone) together with flavonoids and tannins [19-21]. Henna extracts have been reviewed for environmental uses [22] and have been loaded into a hydrogel for wound dressing [23], but we found no report of a henna extract inside an SA-g-PAA network used for AO.
In this work an L. inermis leaf extract was loaded into an SA-g-PAA hydrogel, and the product was used to adsorb AO from water. The effects of pH, added salts, contact time and temperature were measured. The data were then analysed with kinetic, isotherm and thermodynamic models.
MATERIALS AND METHODS
Materials
Sodium alginate (SA, Sigma-Aldrich, medium viscosity), acrylic acid (AA, Merck, 99%), N,N′-methylenebisacrylamide (MBA, Sigma-Aldrich, 99%) and potassium persulfate (KPS, BDH, 98%) were used as received. Auramine O (C17H22ClN3, 303.83 g mol−1, Sigma-Aldrich, ≥85%) was the adsorbate. NaCl, KCl and CaCO3 (Merck, AR grade) were used in the ionic-strength tests. NaOH (0.1 mol L−1) and HCl (0.1 mol L−1) were used for pH adjustment. All solutions were prepared with deionised water.
Preparation of the leaf extract
The leaves were washed, dried in shade at room temperature for 7 days and ground to a fine powder. Ten grams of the powder was extracted with 200 mL of deionised water at 80 °C for 60 min with magnetic stirring. The mixture was cooled and filtered through Whatman No. 1 filter paper, and the filtrate was used as the leaf extract (LIE).
Synthesis of the LIE-loaded hydrogel
The hydrogel was prepared by free-radical graft copolymerisation with MBA as cross-linker and KPS as initiator, the route generally used for SA-g-PAA gels [14,15,18]. The steps are shown in Fig. 1. SA (1.0 g) was dissolved in deionised water (50 mL) at 60 °C under magnetic stirring until a homogeneous solution was obtained. The LIE (10 mL of filtrate) was added and stirred for 15 min. KPS (0.10 g, dissolved in 5 mL of water) was then added as initiator, and the mixture was stirred for 10 min under nitrogen. AA (3.0 mL) and MBA (0.05 g, dissolved in 2 mL of water) were added, and the reaction was continued at 70 °C for 3 h. The gel was cut into pieces, washed with deionised water until the wash was neutral, dried at 50 °C for 24 h, and ground and sieved to < 250 µm.
Characterization
FTIR spectra were recorded on a Shimadzu IRAffinity-1 spectrometer in ATR mode (4000–400 cm−1, 32 scans, resolution 4 cm−1). XRD patterns were obtained with a Rigaku MiniFlex 600 diffractometer (Cu Kα, 40 kV, 15 mA, 2θ = 5–80°, step 0.02°). The morphology was examined by FE-SEM (TESCAN MIRA3, 15 kV). The equilibrium swelling ratio was measured gravimetrically: 0.1 g of dry hydrogel was immersed in 50 mL of buffer at a given pH for 24 h, the swollen gel was blotted and weighed, and the swelling ratio was calculated as (mswollen − mdry)/mdry × 100%. The point of zero charge (pHpzc) was determined by the salt-addition (drift) method: 0.1 g of hydrogel was added to 50 mL of 0.1 mol L−1 NaCl whose pH had been adjusted from 2 to 12, and the final pH was read after 24 h.
Batch adsorption experiments
A stock solution of AO was diluted to the working concentrations. For each test 0.05 g of dry hydrogel was added to 10 mL of dye solution, which is a dose of 5 g L−1, and the mixture was shaken at 150 rpm for the required contact time. The liquid was separated by centrifugation (4000 rpm, 5 min) and the AO concentration was measured by UV–Vis at λmax = 432 nm using the calibration line.
The effect of pH was studied from pH 1.2 to 10 with 80 mg L−1 AO. The effect of ionic strength was studied at the same dye concentration with NaCl, KCl and CaCO3 at 0.001 to 0.1 mol L−1. Both series were run at 293 K (20 °C) with a contact time of 180 min. A kinetic run was carried out at 80 mg L−1 and 293 K with sampling from 2 to 240 min. Equilibrium isotherms were measured at 283, 288, 293 and 298 K with initial concentrations of 10 to 100 mg L−1 and a contact time of 180 min.
The amount adsorbed, qe (mg g−1), and the removal, R (%), were calculated from Eqs. 1 and 2:
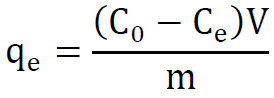
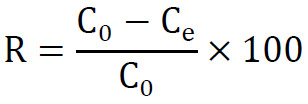
where C0 and Ce (mg L−1) are the initial and equilibrium concentrations, V (L) is the volume of solution and m (g) is the mass of adsorbent. The same equation with Ct in place of Ce gave the uptake at time t, qt.
Kinetic, isotherm and thermodynamic models
The kinetic data were first treated with the linear pseudo-first-order (PFO) and pseudo-second-order (PSO) equations [24]:

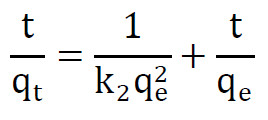
where k1 (min−1) and k2 (g mg−1 min−1) are the rate constants. Because the curve showed an induction period, the non-linear forms were also fitted with a time shift t0 (min):

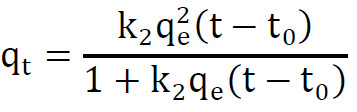
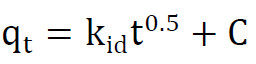
The Weber-Morris equation was used to look for diffusion control, with kid (mg g−1 min−0.5) as the rate constant and C (mg g−1) as the intercept:
The equilibrium data were fitted with the linear Langmuir, Freundlich and Temkin equations [25]:
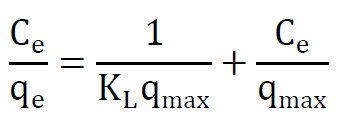
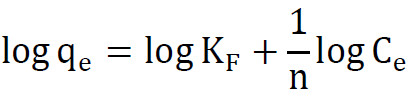
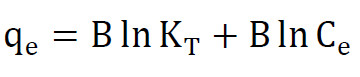
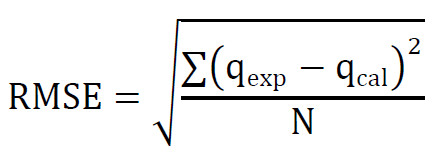
where qmax (mg g−1) is the monolayer capacity, KL (L mg−1) the Langmuir constant, KF and n the Freundlich constants, KT (L mg−1) the Temkin binding constant and B = RT/bT (mg g−1). The separation factor was calculated as RL = 1/(1 + KLC0). The quality of each fit was judged by R2 and by the root mean square error between the measured and calculated uptakes, where N is the number of points:
For the thermodynamic analysis the Langmuir constant was converted to a dimensionless equilibrium constant, K° [26,27]:
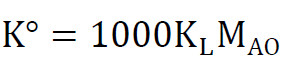
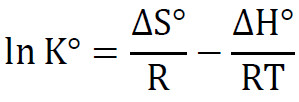
where MAO is the molar mass of AO (303.83 g mol−1) and the factor 1000 converts grams to milligrams. The standard concentration is 1 mol L−1 and the activity coefficient was taken as unity. The standard Gibbs energy, enthalpy and entropy were then obtained from:

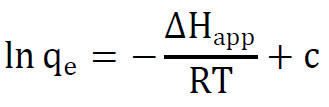
An apparent enthalpy, ΔHapp, was also obtained from the uptake at a fixed equilibrium concentration, where c is a constant:
Linear and non-linear least-squares fits were run in Python with the SciPy library.
RESULTS AND DISCUSSION
Characterization of the hydrogel
Fig. 2 shows the FTIR spectra of SA, LIE, SA-g-PAA and the LIE-loaded SA-g-PAA hydrogel. The SA spectrum has a broad O–H band at 3430 cm−1, asymmetric and symmetric COO− stretches at 1610 and 1420 cm−1, and a strong C–O–C band at 1090 cm−1 from the glycosidic linkage. The LIE spectrum shows O–H absorption of the polyphenolic components at 3350 cm−1, a C=O band at 1660 cm−1 attributable to the quinone carbonyl of lawsone [20], and aromatic C=C bands at 1600 and 1510 cm−1. In SA-g-PAA, a new strong band at 1710 cm−1 confirms the C=O of the grafted poly(acrylic acid) chains. The COO− bands of alginate are still present. The LIE-loaded hydrogel retains the 1710 cm−1 band and shows a shoulder at 1640 cm−1 from the lawsone C=O, a weak band at 1510 cm−1 from the aromatic rings of the extract, and a slightly broader and shifted O–H envelope at 3400 cm−1, which indicates hydrogen bonding between the polyphenols and the hydrogel matrix.
The XRD patterns (Fig. 3) of both the plain and loaded hydrogels show a broad amorphous hump centred near 21.5° and 22.0° (2θ), respectively, with no sharp crystalline reflections. This confirms the amorphous, cross-linked polymer network. The slight shift and broadening in the loaded hydrogel may reflect disturbance of the chain packing by the incorporated LIE molecules.
The equilibrium swelling ratio (Fig. 4a) rose from about 65% at pH 1 to above 1000% at pH 11. Below pH 4 the carboxylic acid groups are protonated and the network is collapsed; above pH 5 the COO− groups repel each other, and the gel swells. The inflection near pH 4–5 corresponds to the pKa region of PAA. The drift method (Fig. 4b) gave pHpzc = 4.2, which means that above this pH the surface carries a net negative charge and is able to attract cationic species such as AO+ through electrostatic interactions.
The FE-SEM images (Fig. 5) reveal the surface morphology of the hydrogels. The plain SA-g-PAA (Fig. 5a) consists of dispersed, angular grains and flat platelets with a broad size distribution, and the surface appears relatively smooth with small scattered fragments. A rod-like crystalline feature is also visible, probably a residual salt crystal from the drying step. After loading with henna leaf extract (Fig. 5b), the morphology changes markedly: the particles become larger, more cohesive aggregates with a rough, bumpy surface and visible macro-pores between them. The rougher texture and denser packing indicate that the polyphenolic and quinone constituents of the extract coat and partially bridge the polymer chains, filling the finer pores while preserving the macro-pore channels that allow dye solution to penetrate the network.
Calibration line
The absorbance of AO grew linearly with concentration (Fig. 6). Nine standards between 10 and 400 mg L−1 gave A = 0.0028C − 0.0048 with R2 = 0.9977, and this equation was used for all later readings. The blank and the 500 mg L−1 standard were measured but left out of the regression, although the 500 mg L−1 point still falls close to the line. No adsorption test used more than 100 mg L−1, which is well inside the linear range. The intercept corresponds to about 1.7 mg L−1, and this sets the lowest concentration that the method can report.
Effect of solution pH
Fig. 7 shows the uptake at 80 mg L−1 AO for initial pH values from 1.2 to 10. The highest uptake, 9.15 mg g−1 (57.2% removal), was found at pH 1.2. It then fell almost linearly, by about 0.8 mg g−1 per pH unit (R2 = 0.984), and reached 1.73 mg g−1 (10.8%) at pH 10. At pH 7 the uptake was 4.59 mg g−1, half of the value in strong acid.
This is not the usual picture for a cationic dye on a carboxylic gel. With alginate/PAA and starch-based hydrogels the uptake of methylene blue rises with pH, because more COOH groups are ionised [28,29], and AO itself was taken up better at neutral or alkaline pH by plant biosorbents [8,9]. Electrostatic attraction alone therefore cannot explain Fig. 7. Two effects probably work together. In acid the network is protonated and compact, and the dye can still be held by hydrogen bonds to the COOH and OH groups and by π-π stacking with the aromatic rings of the extract. Both interactions have been reported for cationic dyes on PAA-based gels [30,31]. As the pH rises the carboxyl groups ionise and the gel swells more [12,32]. Lawsone and the other phenolics are then ionised too, and part of the extract may leave the swollen network. That would remove binding sites and also add colour to the solution, which lowers the apparent uptake. AO is also known to be less stable in strongly acidic and strongly alkaline solutions, so the two ends of the series should be read with care.
Dye blanks (80 mg L−1 AO without adsorbent) were prepared at each pH and showed no measurable change in absorbance after 180 min, confirming that AO did not degrade or precipitate over the pH range studied. Hydrogel blanks (adsorbent in deionised water, no dye) showed no colour leaching into the solution at any pH, except a faint yellow tinge at pH 1.2 that was below the quantification limit of the calibration line. These controls indicate that the measured uptake reflects true adsorption of AO onto the hydrogel.
Effect of ionic strength
The salt series was also run at 80 mg L−1 AO (Fig. 8). Without salt the uptake was 4.73 mg g−1. This is lower than the plateau of the kinetic run in previous section, probably because the two series came from separate batches and working temperatures. All three salts lowered the uptake, and with NaCl and KCl the effect was visible from 0.001 mol L−1. At 0.01 mol L−1 the uptake was 1.94 mg g−1 with NaCl, 1.38 mg g−1 with KCl and 2.36 mg g−1 with CaCO3, a loss of 59, 71 and 50%. At 0.1 mol L−1 almost nothing was adsorbed (0.51, 0.01 and 0.51 mg g−1). With NaCl the uptake did not change any more above 0.05 mol L−1.
Such a strong salt effect means that charge interactions matter at the natural pH of the dye solution. The added cations screen the COO− groups and compete with AO+ for them, and the swelling of a polyelectrolyte gel also drops as the salt concentration rises [33]. Lower dye uptake at higher ionic strength has been reported for methylene blue on alginate-based and sulfonated hydrogels [34,35]. KCl was more harmful than NaCl. A likely reason is the smaller hydrated radius of K+, which lets it come closer to the carboxylate sites. CaCO3 gave the weakest effect, although divalent cations usually depress adsorption the most [36]. The reason is probably its very low solubility. The concentrations quoted for this salt are the amounts added, and the dissolved Ca2+ level must have been much lower. The same three electrolytes were used in a recent study of fuchsin basic on an acrylic acid hydrogel [37]. Whatever the exact cause for each salt, the result sets a practical limit: the gel will lose most of its capacity in effluents that contain salt.
Effect of contact time
Fig. 9 shows the kinetic run at 80 mg L−1. During the first 6 min the absorbance of the liquid stayed slightly above that of the feed, so no net uptake could be calculated (inset of Fig. 9). The concentration crossed the feed value after about 7 min. We call this interval the induction period. It is most likely the time that the dry particles need to wet and start to swell. A small release of coloured extract constituents during wetting would also raise the first readings. The readings before 8 min were therefore left out of the kinetic fits. After that the uptake was fast: 1.04 mg g−1 at 10 min, 4.79 mg g−1 at 30 min and 5.56 mg g−1 at 40 min, which is 89% of the final value. Then the curve flattened. The uptake was 6.20 mg g−1 at 140 min and stayed between 6.21 and 6.23 mg g−1 up to 240 min, so 140 min was taken as the equilibrium time. The mean plateau value, qe,exp = 6.22 mg g−1, corresponds to 38.9% removal. In solution the concentration dropped from 77.9 mg L−1 at 8 min to 48.9 mg L−1 at equilibrium. The plateau is the same as the 293 K isotherm point for this concentration.
Adsorption kinetics
Table 1 lists the kinetic parameters and Fig. 10 shows the fits. The linear PFO plot is curved (Fig. 10b, R2 = 0.873), and its qe of 4.62 mg g−1 is far from the measured value. The linear PSO plot looks much better, with R2 = 0.992 and qe = 6.85 mg g−1. On this basis alone the PSO model would be chosen, as in most dye studies. But the t/qt plot is known to give high R2 values almost regardless of the real mechanism, because t appears on both axes [38-40]. It is also not sensitive to errors at short times [41]. Here the points before 40 min clearly leave the line (Fig. 10c), and the PSO constants reproduce the measured curve with an RMSE of 0.71 mg g−1. The initial rate from this plot, h = 0.37 mg g−1 min−1, has little meaning either, since the first minutes show no uptake at all.
The non-linear fits give a different answer. When the induction time is included (Fig. 10a), the PFO equation follows the whole curve with R2 = 0.993 and RMSE = 0.17 mg g−1, and it returns qe = 6.18 mg g−1, almost the same as the experiment. The PSO equation is worse (R2 = 0.978, RMSE = 0.29 mg g−1) and overshoots the plateau. The fitted t0 of 7.0 min agrees with the induction period seen in Fig. 9. Without t0 both models fit poorly (R2 = 0.940 and 0.899). So once the particles are wetted, the rate is simply proportional to the capacity that is still free, and half of it is filled about 12 min after the induction period ends. PFO behaviour was also found for a phytochemical-alginate adsorbent [16] and for AO on ceramic oxides [42].
The Weber-Morris plot (Fig. 10d) has two straight parts and a plateau. The first part, from 8 to 30 min, is steep (kid = 1.60 mg g−1 min−0.5) and has a negative intercept that comes from the induction period. The second, from 40 to 140 min, is about fifteen times slower. In this stage the driving force is small, because both the dye left in solution and the number of free sites have dropped. Neither line passes through the origin, so diffusion inside the particle is not the only step that limits the rate.
Adsorption isotherms
The equilibrium data at the four temperatures are collected in Table 2 and plotted in Fig. 11a. The uptake increased with the initial concentration and with temperature. At 100 mg L−1 it was 5.30, 5.93, 6.64 and 7.73 mg g−1 at 283, 288, 293 and 298 K. The removal moved the other way with concentration. It was about 80% or more at 10 mg L−1, where the dye left in solution was close to the limit of the method, and only 26.5 to 38.6% at 100 mg L−1. This is expected for a fixed number of sites.
Table 3 gives the constants of the three models. Judged by the linear plots (Fig. 11b to d), the Langmuir equation is the best at 293 and 298 K (R2 = 0.989 and 0.996) and the Freundlich equation is slightly better at 283 and 288 K. The R2 values of different linear forms are not really comparable, though, because each transformation changes the error structure [40,43]. We therefore also compared the calculated and measured qe values directly. On that basis the Langmuir constants give the largest RMSE at every temperature. The Freundlich equation has the smallest error at 283 and 288 K and the Temkin equation at 293 and 298 K. Both models assume sites of unequal energy. This fits a network that carries carboxylate groups from two polymers plus the phenolic groups of the extract. The Freundlich exponents 1/n (0.23 to 0.38) are well below 1, as expected when the best sites are filled first.
As an example of the calculation, the Langmuir plot at 293 K has a slope of 0.1351 g mg−1 and an intercept of 1.1995 g L−1. These give qmax = 1/0.1351 = 7.40 mg g−1 and KL = 0.1351/1.1995 = 0.113 L mg−1. The Freundlich plot at the same temperature has a slope of 0.3764 and an intercept of 0.1756, so n = 2.66 and KF = 100.1756 = 1.50.
The Langmuir fit is still useful as an estimate of capacity. qmax increased from 6.05 mg g−1 at 283 K to 8.17 mg g−1 at 298 K (Fig. 12d), and KL rose about four times over the same range. The RL values lie between 0.04 and 0.61 and the Freundlich n values between 2.7 and 4.4, so the adsorption is favourable at all the concentrations tested. At 298 K the highest measured uptake, 7.73 mg g−1, is already 95% of qmax, which means the gel was close to saturation in these tests. The Temkin constant bT was around 2 kJ mol−1. One point needs a comment. At 298 K the lowest concentration gave no measurable absorbance after adsorption, and this point was left out of the linear fits.
Thermodynamic parameters
The uptake at a fixed equilibrium concentration of 61.36 mg L−1 was read from the isotherms. This is the highest Ce reached at 298 K, and the values at the other temperatures were found by linear interpolation. The uptake was 4.77, 5.40, 6.52 and 7.73 mg g−1 at the four temperatures. A plot of ln qe against 1/T is linear (Fig. 12a, R2 = 0.991), and its slope gives an apparent enthalpy of +22.9 ± 1.6 kJ mol−1. This number describes how fast the amount adsorbed grows with temperature at a given dye level.
For the standard functions an equilibrium constant is needed. The use of qe/Ce or KF for this purpose has been criticised, and a dimensionless constant derived from an isotherm model is preferred [26,27,44]. With K° from the Langmuir constants, ΔG° was −23.2, −24.5, −25.4 and −28.0 kJ mol−1 at 283, 288, 293 and 298 K (Table 4, Fig. 12c). At 298 K, for example, K° = 1000 × 0.2617 × 303.83 = 7.95 × 10⁴ and ΔG° = −8.314 × 298 × ln(7.95 × 10⁴) = −27.96 kJ mol−1. The van ‘t Hoff plot (Fig. 12b) gave ΔH° = +61.8 kJ mol−1 and ΔS° = +300 J mol−1 K−1. The plot has only four points and R2 = 0.909, so these two values are approximate. Their standard errors are 14 kJ mol−1 and 48 J mol−1 K−1.
The signs are clear all the same. The process is spontaneous, and more so at higher temperature. It is endothermic, as was reported for AO on modified activated carbon, moss and chickpea pods [5,9,45], while exothermic uptake was found on other solids [42,46]. For a hydrogel the positive enthalpy has a simple origin. The swelling of acrylic gels increases with temperature [32], and this opens more of the network to the dye. The positive entropy is consistent with the release of water molecules and counter-ions when AO+ takes a site. At 298 K the term TΔS° is about 89 kJ mol−1, which is larger than ΔH°, so the process is driven by entropy. ΔH° is larger than the apparent enthalpy because it follows the affinity constant KL, whereas the apparent value follows the amount adsorbed.
Proposed adsorption mechanism
Fig. 13 summarises the picture that these results suggest. The dry particle first has to wet and swell, which accounts for the induction period. AO+ then diffuses into the network and is held mainly by the carboxylate groups of the alginate and PAA chains, with exchange of Na+. The collapse of the uptake in salt solutions supports this. Hydrogen bonds between the amine and iminium groups of the dye and the COOH and OH groups of the gel are a likely extra contribution, and so is π-π stacking with lawsone and the flavonoids of the extract. They would explain the uptake that remains at low pH. The slow second stage of the Weber-Morris plot would then be the dye moving deeper into the swollen particle. The same mix of electrostatic and non-covalent forces was found by DFT for AO on a nacrite hybrid [46] and was proposed for cationic dyes on a curcumin-modified PAA hydrogel [30]. No spectroscopic evidence was collected in this work, so the scheme is only a proposal.
FTIR spectra recorded before and after AO adsorption (Fig. 14) support this picture. After adsorption, the O–H band shifted from 3400 to 3380 cm−1, consistent with new hydrogen bonds between the dye and the hydrogel. The COO− symmetric stretch at 1420 cm−1 weakened, suggesting that some carboxylate groups are now paired with AO+. A new band at 1660 cm−1 and a band at 1370 cm−1 appeared; these correspond to the C=N stretching and CH3 bending of the dimethylamino groups of AO, confirming the presence of the dye on the adsorbent surface.
Comparison with other adsorbents
Table 5 compares the capacity with published values. The LIE-loaded hydrogel is far below the best AO adsorbents, which reach 100 to 440 mg g−1 [5-9,42]. It is closer to the untreated biosorbents and biopolymers used for other cationic dyes, which give 6 to 31 mg g−1 [47-51]. Part of the gap comes from the test conditions, since a dose of 5 g L−1 with at most 100 mg L−1 of dye cannot load the gel heavily. Part of it is real: the uptake is easily suppressed by salts and falls as the pH rises. The material is cheap and made from harmless components, but it needs a higher capacity before it can compete. A lower dose and a comparison with the extract-free gel are the obvious next tests. The values in Table 5 were also measured at different doses and concentration ranges, so the comparison is only indicative.
CONCLUSION
An SA-g-PAA hydrogel loaded with L. inermis leaf extract was prepared and tested for the removal of Auramine O. The uptake was highest in acid and fell steadily up to pH 10. This trend differs from the usual behaviour of cationic dyes and should be checked with blank tests. NaCl, KCl and CaCO3 all suppressed the adsorption, and 0.01 mol L−1 of salt was enough to remove half of it or more. The kinetic curve had an induction period of about 7 min, followed by fast uptake that reached 6.22 mg g−1 in about 140 min. The linear pseudo-second-order plot fitted well, but the non-linear analysis with an induction time favoured the pseudo-first-order model. The equilibrium data pointed to a heterogeneous surface, with Langmuir capacities of 6.05 to 8.17 mg g−1 between 283 and 298 K. The adsorption was spontaneous and endothermic. Electrostatic attraction to carboxylate groups, helped by hydrogen bonding and π-π stacking with the extract, is the most likely mechanism. The capacity is low compared with other AO adsorbents. Further work should compare the material with the extract-free gel and test its regeneration.
ACKNOWLEDGEMENTS
The authors thank the Department of Chemistry, College of Education, University of Al-Qadisiyah, Al-Diwaniyah, Iraq, for providing the laboratory facilities and analytical instruments used in this study. No external funding was received for this work.
CONFLICT OF INTEREST
The authors declare that there is no conflict of interests regarding the publication of this manuscript.
