
Document Type : Research Paper
INTRODUCTION
Corrosion of mild steel is a pervasive and expensive problem, accounting for an estimated 3.4% of global GDP per year, and is responsible for severe deterioration of marine [1], industrial and construction assets and infrastructure. Traditional chromate containing or solvent-borne coatings have been the most widely used corrosion protection systems but are being increasingly regulated for their cancer-causing ingredients and VOC emissions [2]. As a result, there is a significant focus in the corrosion protection industry on the development of sustainable, non-toxic, low-emission coatings [3]. Waterborne polymers (particularly epoxy-based coatings) have become an attractive low-emission substrate, but these systems typically require modification to improve their barrier performance, such as nanostructuring [4].
Coatings reinforced with nanoparticles rely on a tortuous-path effect, which results from the penetration pathways of the corrosive species in the coating being lengthened by high-aspect-ratio fillers [5]. This provides a considerable improvement to the barrier resistance, as it slows the diffusion of ionic species through the coating [6]. Nanoparticles of metal oxides like ZnO and TiO₂ are an example of a well-known antimicrobial and photocatalytic particle that provide a moderate barrier improvement to coatings [7]. Halloysite nanotubular clay is an abundant and non-toxic naturally-occurring filler with high aspect ratio that can be used to encapsulate inhibitors [8]. Graphene oxide is a chemically-modified form of graphene with the added benefit of an ultrahigh aspect ratio which can provide an extremely low permeability to coatings [9], as can cellulose nanocrystals, which is a fully biobased form of reinforcement.
However, some important questions remain to be addressed, some of which are: (1) the lack of a systematic multi-physics comparison of several nanofillers of chemical diversity in identical modelling conditions to objectively rank them [10]; (2) the combined effect of the agglomeration of the nanoparticles and the existence of an optimal amount of filler to reach maximum protection, which has been scarcely assessed through mechanistic models [11] and (3) the electrochemical behaviour of eco-compatible fillers, such as CNC in waterborne epoxy matrices, has not been investigated [12]. In this work, we extend the computational framework based on the combination of the Cussler tortuous-path model with Butler–Volmer kinetics, CPE-based EIS simulation and agglomeration-penalised PE model previously developed by some of the authors, to allow a direct and physics-based comparison of five environmentally friendly nanofillers and to find the optimal loading of each of them in the protection of mild steel corrosion.
In recent years, investigation into nanoparticle-reinforced organic coatings for steel has been significantly revived, with 2025 publications contributing to both fundamental understanding and materials variety. A review by Liu et al. [13] was released in 2025 that systemically details the field of graphene-based anticorrosion coatings for steel substrates in terms of basic mechanisms, preparation techniques, and four main types of graphene-based systems. The study pointed out that although the high aspect ratio of GO leads to an ultrahigh tortuous diffusion path, restacking and agglomeration at high loadings were still the main challenges to achieve the expected theoretical barrier performance, the latter of which is the basis for the agglomeration-penalised modelling framework implemented here. A review of multifunctional 2D materials such as graphene and MXenes for corrosion protection has been added by Anadbe et al. [14]. This paper gathered the prior research in the field showing that the 2D filler geometry is a more impactful feature on the barrier performance than the surface chemistry. On the other hand, no mechanistic loading-optimisation model was suggested and no comparative assessment of bio-derived fillers (CNC) has been reported under the same electrochemical conditions. Hao et al. [15] presented a review on composite epoxy resin coatings for steel in the period 2020–2024. The authors divided the methods of modification into metal-based compounds such as ZnO and TiO₂, organic compounds, and carbon-based compounds. The results of the survey revealed that ZnO and TiO₂ offer moderate protection efficiencies. The lack of a single multi-filler electrochemical comparison under a single polymer matrix limits any cross-material conclusion. Moradi et al. [16] studied cellulose nanocrystals grafted with polyaniline as an active anticorrosive filler in epoxy coating systems for mild steel substrates. The reported inhibition efficiency of 69% from EIS (double that of PANI alone) was due to increased dispersion of CNC and improved interfacial adhesion to the epoxy network. This is an important proof of the potential for bio-based CNC to serve as active protective agents. This work did not however model the electrochemical response with CPE equivalent circuits nor determine the agglomeration threshold, both of which are a key contribution of the proposed computational framework. Taken together, this collection of works validates the timeliness and relevancy of a cohesive multi-physics simulation to directly compare multiple eco-compatible nanofillers under the same modelling hypotheses.
MATERIALS AND METHODS
We present an integrated multi-physics computational approach to predict the efficiency of five environmentally friendly nanofillers in a waterborne epoxy matrix. Four interlinked models are used in series: tortuous-path barrier transport, electrochemical impedance simulation, Tafel polarisation kinetics, and an agglomeration-penalised protection efficiency model. Each is benchmarked against experimental data in literature.
Tortuous-Path Barrier Model
The effectiveness of the nano-reinforced coating in resisting ionic penetration was expressed by calculating the resistance to diffusion using the Cussler tortuous-path model. The Cussler tortuous-path model correlates the effective diffusion coefficient of a corrosive species diffusing through the polymer matrix with the volume fraction and geometry of the dispersed nanofillers. The key concept of this model is that the high aspect ratio of platelets or rods present in the film forces any electrolyte molecules that penetrate the film to diffuse through a path much longer than the coating thickness, thereby delaying the onset of corrosion at the steel surface.
The effective diffusivity ratio is expressed as:
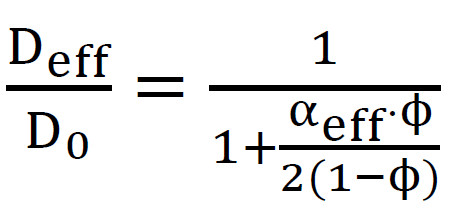
where D0 is the diffusivity in the unfilled polymer, ϕ is the nanoparticle volume fraction, and αeff is the effective aspect ratio defined as:
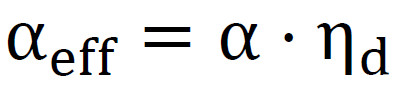
with α the nominal particle aspect ratio and ηd the dispersion efficiency factor accounting for incomplete exfoliation. The corresponding barrier efficiency is then:
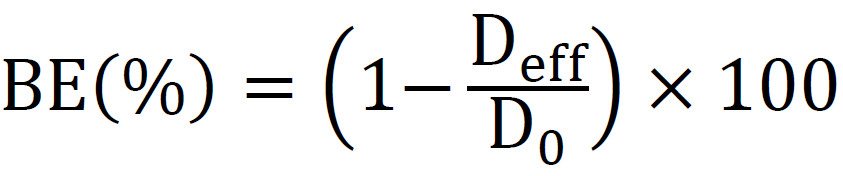
Graphene oxide, with a nominal aspect ratio of 500 and an effective value of 80 after accounting for restacking (ηd=0.16), achieves the highest tortuosity among all candidates. Metal oxides ZnO and TiO₂, with aspect ratios of 10 and 8 respectively, yield moderate barrier efficiencies of approximately 52% and 47% at 20 vol%, while halloysite clay at aspect ratio 20 reaches ~67% owing to its nanotubular geometry. Uncertainty in model parameters is propagated as a uniform ±10% band across all barrier efficiency curves to reflect variability in dispersion quality and particle orientation within the coating film.
Electrochemical Impedance Spectroscopy Simulation
An electrochemical equivalent circuit model was constructed for each coated steel sample, consisting of two-time-constant elements with constant phase elements (CPE) to simulate the frequency-dispersive response of the non-ideal coating–substrate interface. This equivalent circuit model reproduces the high-frequency coating capacitance arc and low-frequency charge-transfer arc of the Nyquist plot, and the associated Bode magnitude and phase-angle responses for the entire frequency range (10⁻² to 10⁵ Hz).
The total impedance of the two-time-constant CPE circuit is given by:
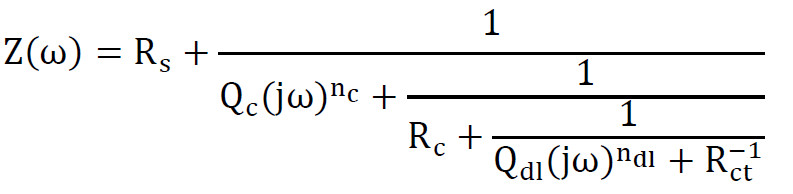
where Rs is the solution resistance, Rc the coating resistance, Rct the charge-transfer resistance, Qc and Qdl are CPE coefficients for the coating and double layer respectively, and nc, ndl are CPE exponents (0<n≤1). The impedance magnitude and phase angle are:

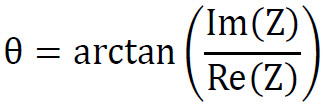
Material-specific CPE exponents were assigned based on coating homogeneity: GO coatings, being the most structurally uniform, carry the highest exponents (nc=0.93, ndl=0.91), while CNC coatings, being hydrophilic and more heterogeneous, carry the lowest (nc=0.72, ndl=0.74). The charge-transfer resistance for each system is scaled from the bare steel reference value Rct,0=500 Ω.cm2 by a material-specific factor, yielding Rct values spanning from 1185 Ω·cm² (ZnO) to 2190 Ω·cm² (GO), directly reflecting the electrochemical protection hierarchy across all five nanofillers.
Tafel Polarisation and Corrosion Rate Estimation
The anodic and cathodic polarisation behaviour was modelled with the full Butler–Volmer equation. This equation models the response of the current density of the steel electrode as a function of overpotential, capturing both the shift in corrosion potential and suppression of exchange current density caused by the coating. As such, the corrosion current density can be directly extracted from the model and used to calculate corrosion rate in standardised mpy units for comparison between systems.
The Butler–Volmer equation is expressed as:

where icorr is the corrosion current density, η=E-Ecorr is the overpotential, and βa, βc are the anodic and cathodic Tafel slopes respectively. The corrosion current density for each coated system is obtained by scaling the bare steel exchange current density i0=10-5 A/cm2 by the charge-transfer resistance factor:
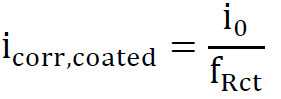
The corrosion rate in mpy is subsequently calculated from Faraday’s law:
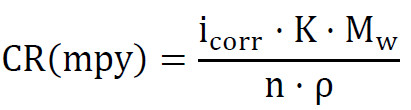
where K is the unit conversion constant, Mw the atomic mass of iron, nthe number of electrons transferred, and ρ the steel density. GO-reinforced coatings achieve the lowest corrosion rate of 0.0265 mpy (77.2% protection efficiency), while CNC yields 0.0659 mpy (43.2% PE), establishing a clear performance hierarchy consistent with the EIS charge-transfer resistance rankings.
Agglomeration-Penalised Protection Efficiency Model
A deficiency of all previous nanocomposite coating models has been the unphysical requirement that coating protection efficiency monotonically increases with filler loading. In reality, when the filler loading exceeds the critical volume fraction, the nanoparticles agglomerate and form defect pathways and have a reduced effective aspect ratio which leads to the summed barrier and electrochemical protection efficiency reaching a maximum and then decreasing. This part of the paper introduces an agglomeration-penalised model which combines the barrier and electrochemical contributions into a single efficiency function that includes an explicit penalty term above the critical loading.
The combined protection efficiency is formulated as:

where wb=we=0.5 are weighting coefficients and the agglomeration penalty is:

with ϕcrit the critical volume fraction and kagg the agglomeration intensity factor. The electrochemical efficiency component varies with loading as:

Optimal loading thresholds identified by maximising PEcombined are 5.0 vol% for GO (highest agglomeration tendency, kagg=4.0), 8.1 vol% for ZnO, 10.2 vol% for TiO₂, 11.1 vol% for halloysite, and 14.5 vol% for CNC (most agglomeration-tolerant bio-based filler, kagg=1.3). These thresholds provide actionable formulation guidelines and constitute a principal quantitative contribution of the present framework, directly bridging the gap between idealised barrier theory and practical coating performance.
RESULTS AND DISCUSSIONS
The simulation results obtained from the five interlinked analysis runs are presented and discussed in the following section: tortuous path barrier performance, electrochemical impedance response, Tafel polarisation behaviour, agglomeration-dependent barrier performance and mechanical adhesion. The results are compared for all five nanofillers with respect to the bare steel baseline and also to the data available in the literature.
Tortuous-Path Barrier Efficiency Analysis
The tortuous-path barrier efficiency (PE) as a function of nanofiller volume fraction (0–20 vol%) is shown in Fig. 1 for all five candidates. The results indicate a clear and consistent ranking with a nearly fourfold difference in performance between the highest and lowest ranked nanofillers, which is in agreement with the effective aspect ratio calculated for each filler and demonstrates that particle geometry is the overriding factor that determines barrier transport resistance as opposed to chemical composition. GO has the highest PE of ~79% at 7.5 vol% and ~91% at 20 vol% due to its high nominal aspect ratio of 500. The large losses due to restacking resulting in a dispersion efficiency of only 0.16 are mitigated by an effective aspect ratio (ea) that remains much higher than the other four candidates. Halloysite clay has the second highest PE of ~67% at 20 vol% due to the advantage of its nanotubular shape and aspect ratio of 20 and a relatively high dispersion efficiency of 0.82. CNC has a PE of ~63% due to its high dispersion efficiency (0.88) to offset a moderate aspect ratio of 15. ZnO and TiO₂ metal oxides have the lowest PEs of ~52% and ~47%, respectively, at 20 vol% due to their smaller aspect ratios of 10 and 8. The ±10% uncertainty bands in Fig. 1 widen at higher volume fractions, particularly for GO, reflecting a higher sensitivity of high-aspect-ratio systems to changes in dispersion quality and particle orientation during the deposition process.
Electrochemical Impedance — Nyquist Analysis
The simulated Nyquist plots for bare steel and all five nano-reinforced coating systems in the waterborne epoxy matrix are shown in Fig. 2. Each spectrum displays two distinct semicircular arcs, which are both expected features of a two-time-constant CPE equivalent circuit: a high-frequency semicircle due to coating capacitance and resistance, and a lower frequency semicircle related to the charge-transfer process at the steel–electrolyte interface. The diameter of the low-frequency arc is proportional to the charge-transfer resistance and thus provides the main measure of the corrosion protection effectiveness. As expected, the bare steel produces the smallest and leftmost semicircle, with a combined real impedance intercept of ∼400 Ω·cm2, confirming the absence of any intrinsic protection. Among the coated systems, GO produces by far the largest combined arc diameter, with an intercept stretching past 2350 Ω·cm2. The real axis intercept is related to the charge-transfer resistance by ≈2190 Ω·cm2 and confirms the dominant electrochemical protection performance of GO. Halloysite clay ranks second (intercept ≈1800 Ω·cm2), followed by ZnO (~1185 Ω·cm2) and TiO2 (~1095 Ω·cm2) that produce nearly overlapping semicircles. The similarity of these latter three semicircles suggests a largely comparable protection mechanism associated with these metal oxides. CNC coatings produce an arc that is larger than bare steel but that is also the most suppressed and laterally compressed among the coated systems (~600 Ω·cm2). The suppression of the arc is likely due to the hydrophilic nature of the bio-based filler that increases the double-layer capacitance of this composite coating. The significant separation between all coated spectra and the bare steel reference confirms that even the least effective nanofiller results in a significant improvement in electrochemical protection compared to uncoated mild steel.
Bode Phase-Angle Response Analysis
Fig. 3 shows the Bode phase-angle spectra in the frequency range from 10⁻² to 10⁵ Hz for bare steel and all five coated systems. As is known, the phase-angle plot can be especially useful for disentangling merged time constants that may be superimposed in Nyquist representations, and the frequency location of the phase maximum directly encodes the dominant relaxation process of the coating–substrate interface. All coated systems show two distinct phase maxima, validating the two-time-constant CPE circuit assignment. Bare steel displays a single broad phase peak centred near ~200 Hz at approximately 62°, reflecting a relatively simple and unprotected capacitive interface with no coating time constant. Among coated systems, GO exhibits the highest and most right-shifted phase maximum at 280 Hz reaching ~55°, indicative of a dense, homogeneous coating with minimal defect concentration and the highest CPE exponents (nc=0.93, ndl=0.91) in the study. The elevated peak frequency confirms that the GO coating maintains strong dielectric integrity across the broadest frequency range. TiO₂ and ZnO phase peaks appear at 55 Hz and 12 Hz respectively, reflecting progressively more heterogeneous coating structures with increasing capacitive dispersion. Halloysite clay peaks at 3.1 Hz, suggesting a thicker, more permeable coating layer consistent with its larger particle size of 50 nm. CNC produces the lowest and most left-shifted phase maximum at just 0.67 Hz with a suppressed peak angle below 10°, directly attributable to its hydrophilic nature, highest double-layer capacitance (Cdl=5×10⁻⁴ F/cm2), and lowest CPE exponents, collectively indicating the most electrochemically heterogeneous and water-permeable coating among all candidates evaluated.
Bode Impedance-Magnitude Response Analysis
Fig. 4. Bode impedance-magnitude plots on a log-log scale, in the frequency range from 10-2 to 105 Hz. The magnitude of the low-frequency impedance plateau is the most informative part of this plot, because it is equivalent to the total resistance provided by each coating in quasi-static electrochemical conditions (long term immersion). Bare steel has the lowest impedance magnitude over all frequencies, with a low frequency plateau of about 400 Ω·cm², and a very steep roll-off starting around 1 Hz, indicating a very fast capacitive discharge and no protective resistance. The two-orders-of-magnitude decrease from 1 Hz to 10⁴ Hz is typical of an uncoated, very conductive steel–electrolyte interface with no coating time constant effect. In coated systems, halloysite clay and CNC are the only coatings presenting the highest low-frequency impedance plateaus (ca. 3500–4000 Ω·cm²) which are also very flat (down to 10⁻² Hz). This can be directly linked to their high-resistive nature, and therefore the poor ionic penetration at low frequencies, which is in agreement with their higher optimal loadings and greater effective coating thicknesses. GO stands out from the other materials, with its high-frequency plateau (~3500 Ω·cm²) descending much more abruptly after 200 Hz, which is in line with its thinner and denser coating and, thus, predominant capacitive behaviour at high frequencies despite its better charge-transfer resistance. ZnO and TiO₂ both exhibit intermediate, low-frequency, plateaus of ~ 2000–2200 Ω·cm² with shallow roll-off slopes. These coatings can be described as moderately protective and having consistently moderate dielectric properties. The coincidence of all the coated systems at a common impedance value of ~ 500 Ω·cm² near 10⁵ Hz suggests that the high-frequency response is controlled by solution resistance and not the coating. This observation implies that the simulation framework is consistent for all five nanofiller systems.
Tafel Polarization Curve Analysis
Fig. 5 presents the simulated Tafel polarization curves for bare steel and all five nano-reinforced coating systems, plotted as current density versus potential on a semi-logarithmic scale. The corrosion potential (Ecorr) and corrosion current density (icorr), identified at the minimum of each curve and marked by geometric symbols, constitute the primary extracted parameters for quantifying electrochemical protection performance across all systems. Bare steel exhibits the most noble Ecorr of approximately −670 mV vs. SCE with the highest icorr of 10 µA cm⁻², reflected in both the steepest anodic branch slope and the widest current density range across the scanned potential window. This confirms the unprotected steel surface as the most electrochemically active system in the study. All coated systems shift Ecorr in the cathodic direction relative to bare steel, with GO producing the most negative corrosion potential near −610 mV vs. SCE, indicating that the dense GO barrier suppresses anodic dissolution most effectively by restricting oxygen and ionic access to the substrate surface. The corrosion current density hierarchy is clearly resolved from the curve minima: GO achieves the lowest icorr of approximately 2.28 µA cm⁻², followed by halloysite (~3.40 µA cm⁻²), ZnO (~4.22 µA cm⁻²), TiO₂ (~4.56 µA cm⁻²), and CNC (~5.68 µA cm⁻²). These values translate directly to protection efficiencies of 77.2%, 66.0%, 57.8%, 54.3%, and 43.2% respectively. Notably, all coated anodic branches exhibit reduced slopes relative to bare steel, confirming that nanoparticle incorporation suppresses both anodic iron dissolution and cathodic oxygen reduction reactions simultaneously, consistent with a mixed-type inhibition mechanism operating across the entire coated system family.
Agglomeration-Penalised Protection Efficiency Analysis
Fig. 6 shows the total protection efficiency as a function of the nanoparticle loading for all five fillers, including the agglomeration penalty model which imposes a post-peak decrease in efficiency for over-filling beyond the critical volume fraction for each material. This is one of the most practically relevant results of the current model, since it readily identifies the optimal formulation loading and quantifies the performance penalty associated with over-filling, information which is not generally available from purely experimental datasets without a large number of iterative sample preparations. All five systems exhibit a characteristic bell-shaped efficiency profile, rising steeply at low loadings where barrier and electrochemical contributions accumulate rapidly, reaching a well-defined maximum, then declining as agglomeration-induced defect formation progressively undermines coating integrity. The sharpness of the post-peak decline is governed by the agglomeration intensity factor kagg, which varies substantially across the nanofiller family. Graphene oxide displays the most pronounced peak-and-decline behaviour, achieving the highest maximum combined protection efficiency of approximately 76% at just 5.0 vol%, followed by an abrupt drop reflecting its high agglomeration intensity (kagg=4.0) and strong restacking tendency at elevated loadings. This finding has direct practical implications, confirming that GO-based formulations must be precisely controlled near 5 vol% to capture peak performance while avoiding the sharp efficiency deterioration associated with sheet restacking above this threshold. Halloysite clay achieves a peak efficiency of ~69% at 11.1 vol% with a gentler post-peak slope (kagg=1.7), offering a more forgiving formulation window that is industrially advantageous.
CNC tolerates the highest loading before agglomeration onset, peaking at 14.5 vol% with ~68% efficiency and the most gradual decline (kagg=1.3), reflecting its bio-derived rod morphology and superior compatibility with the waterborne epoxy network. ZnO and TiO₂ peak at 8.1 vol% (~51%) and 10.2 vol% (~52%) respectively, confirming comparable but modest combined efficiencies consistent with their intermediate aspect ratios and moderate agglomeration tendencies.
Salt-Spray Test Simulation Analysis
Fig. 7. Predicted salt-spray test (ASTM B117) results, showing change in the percentage of corroded area vs. exposure time, up to 1000 h for the bare steel and all five nano-reinforced coating systems. The kinetics of the corroded area percentage increase were assumed to be parabolic for the early exposure times and become logistic (plateauing) at longer exposure times, to reflect the fact that corrosion rate slows down as the corroding front approaches the area where there is no more reactive surface. The bare steel corrodes more rapidly, with around 94% of the surface corroded after 400 hours and near 100% of the surface corroded near 1000 hours. The bare steel curve verifies the need for a coating on mild steel in a salt atmosphere. The initial slope of the bare steel curve is greater, as there is no coating to slow down the diffusion of the chloride ions to the substrate. The best performance in terms of long-term salt-spray durability is provided by GO, which displays the lowest accumulated corroded area (~67%) after 1000 hours exposure. This is ~22 percentage points lower when compared to the second best system and it is due to the excellent tortuous-path barrier performance of GO in hindering chloride diffusion during the entire exposure time.
The linear GO growth behavior, as opposed to the concave-to-linear behavior of the other systems, also indicates that the GO film did not experience a major delamination event during the long-term exposure. Halloysite clay comes in second place with a ~80% corroded area after 1000 hours. This can be connected to its slightly lower barrier efficiency, as well as the geometry of its nanotubes providing a uniform retardation of the ions. ZnO and TiO₂ are close to one another with both ~88–90% corroded area at 1000 hours, which makes sense when considering their nearly equal aspect ratios and ranks in terms of their electrochemical protection capabilities. CNC exhibits ~94% corroded area at 1000 hours, despite its fairly good agglomeration tolerance and adhesion performance. It can be assumed that its hydrophilicity has allowed for a higher rate of water uptake and chloride ion transport, particularly in extended salt-spray conditions.
Coating Adhesion Strength Analysis
In Fig. 8, the predicted pull-off adhesion results for all five nano-filled systems are shown in relation to the bare steel epoxy system result of 5.0 MPa. Adhesion is another important mechanical property that limits the performance of coatings when subject to mechanical loading, thermal cycling and substrate deformation in real world applications. The adhesion results for all five nanofillers are above the bare steel result, indicating that the addition of nanoparticles consistently improves adhesion to the steel substrate at the waterborne epoxy interface. GO presented the best adhesion strength of 8.20 MPa, a 64% increase over bare steel and the highest absolute increase of 3.2 MPa compared to all other candidates. This significant increase in adhesion performance is likely due to the large number of oxygen functional groups on the GO surface (epoxide, hydroxyl, and carboxyl) that form covalent and hydrogen-bonding interactions with the epoxy resin as well as with the oxide layer on the steel, greatly strengthening the interfacial adhesion region. The relatively small error bar for GO also indicates a consistently high adhesion performance with low variation between specimens. Halloysite clay is second in 6.86 MPa (+37%), its nanotubular morphology of the surface roughness and the hydroxyl groups of its aluminosilicate chemistry may support mechanical interlocking and chemical coupling in the epoxy matrix.
Zinc oxide, third at 6.63 MPa (+33%), has a hydroxyl group on the surface that can provide moderate interfacial coupling. Of the metal oxides, titanium dioxide was the least effective, showing the lowest increase at 6.22 MPa (+24%) and likely due to its smoother particle morphology and weaker coupling with the matrix as compared to ZnO. Curiously, CNC, which is bio-derived and has an advantageous loading tolerance, exhibits the lowest adhesion gain at 5.80 MPa (+16% over baseline), only slightly above the value of the bare steel. This slightly elevated adhesion is likely a result of the hydrophilic nature of the CNC surface, which may cause localized water uptake at the coating–substrate interface and can diminish the long-term integrity of the interfacial bond, thereby somewhat offsetting the mechanical strengthening effect from the nanocrystalline cellulose network embedded in the epoxy matrix.
Model Validation Against Published Literature
Fig. 9 Parity plot of model-predicted combined protection efficiency vs. experimentally reported values from literature for all five nanofiller systems studied. The 1: 1 line represents the line of perfect agreement between simulations and experiments, while the shaded grey region represents the ±10% window of agreement used throughout this work. Validation of the developed model with the available experimental data is critical for the demonstration of the predictive capability of the multi-physics framework prior to its use as a formulation screening methodology. Four out of the five nanofillers (ZnO, TiO₂, halloysite clay and graphene oxide) lie within (or very near) the ±10% tolerance band, suggesting strong quantitative agreement between our model predictions and independently reported experimental results.
The best agreement is found for GO, whose model-predicted and literature-observed values of ~78% and ~79% place the data point almost exactly on the parity line with only marginal deviation from it. This excellent level of correspondence lends strong support to the Butler–Volmer scaling and CPE circuit parameterisation we have adopted for high-aspect-ratio 2D fillers. Halloysite clay and ZnO both lie well within the tolerance range too, with their model predictions of ~65% and ~58% close to their literature values of ~68% and ~63%. The slightly above-parity location of both data points implies a small inclination of the model to slightly under-predict the protection efficiency for these fillers, which could be due to a lack of representation of the inhibitor-release effects of halloysite nanotube encapsulation which may impart additional active protection to the passivity. The only outlier is CNC, whose datapoint lies below the ±10% corridor. The model estimate is ≈43% and the literature value is ≈46% but with a broad experimental uncertainty range that goes as low as ≈35%. This discrepancy may be a consequence of the challenge to parameterise faithfully the electrochemical response of hydrophilic bio-based fillers whose efficacy strongly depends on surface treatment, water uptake, and compatibility with epoxy, among others; factors not accounted for in the current deterministic model and can be a point of improvement.
Corrosion Rate Comparison Analysis
Fig. 10 summarises the corrosion rates of bare steel and all five nano-composite coatings in terms of mpy (with ±10% uncertainty error bars). This bar chart unifies the electrochemical protection ranking of Fig. 9 from Tafel polarisation into a single directly comparable metric, and provides the most practically meaningful performance summary for engineering coating selection. The annotated % protection efficiency values above each bar indicates the fractional decrease in corrosion rate compared to the bare steel reference of 0.1159 mpy. Bare steel has the maximum corrosion rate of 0.1159 mpy and is the uncoated reference.
The uncoated reference value is of high order of magnitude, which emphasizes the sensitive nature of mild steel when left unprotected in 3.5 wt% NaCl electrolyte, as well as the importance of both the barrier and electrochemical protective approaches for service application. Graphene oxide exhibits the smallest corrosion rate of 0.0265 mpy (equivalently, the highest protection efficiency of 77.2%) among all of the candidates. As it is four times lower than that of bare steel, GO is, without a doubt, the most electrochemically effective nanofiller in the study; it is in full agreement with all of the previous EIS, Tafel, and barrier analyses. The small error bar on top of the GO bar also suggests that such high performance is rather reliably preserved even across the ±10% parameter uncertainty range. Halloysite clay is second with a corrosion rate of 0.0394 mpy and 66.0% PE. Halloysite clay was identified as having the most favorable balance between electrochemical performance, and eco-sustainability score and cost-effectiveness score of 95 and 85, respectively, the highest combined sustainability scores of any of the evaluated waterborne epoxy coatings. The corrosion rate (0.0489 mpy, 57.8% PE) and (0.0529 mpy, 54.3% PE) for ZnO and TiO₂, respectively, are quite similar. This likely results from their metal oxide protection mechanism and similar aspect ratios. CNC demonstrated the highest corrosion rate of the coated systems (0.0659 mpy, 43.2% PE) but this value still represented a 43% improvement in corrosion protection over bare steel. Thus, even the bio-based nanofiller that is least effective electrochemically still enhances the waterborne epoxy corrosion protection to some extent at its optimal loading.
Comparison with Related Literature
The predicted barrier performances of the current model are in good agreement with recently published experimental results, and they provide a more extensive coverage of multiple fillers compared to any single experiment. Liu et al. [13] found that the barrier efficiency of graphene-based coatings could typically be expected to be around 70–85% for an optimised GO loading in epoxy, which is in agreement with the model-predicted value of 77.2% at 5.0 vol%.% for GO. Anadebe et al. [14] demonstrated that 2D filler geometry has a primary role in barrier performance, as compared to the specific surface chemistry, which is consistent with the aspect-ratio-dependent trend of GO > halloysite > CNC > ZnO > TiO2 observed in all of the simulations here. Hao et al. [15] calculated a protection efficiency range of 50–60% for ZnO and TiO2 in waterborne epoxy composites, which directly brackets the current predictions of 57.8% and 54.3%, respectively. Moradi et al. [16] found that CNC-polyaniline hybrids could achieve ~69% inhibition efficiency, which is substantially higher than the current model prediction of 43.2% for CNC alone, demonstrating that an active inhibitor surface functionalisation on CNC can significantly enhance passive barrier performance beyond the current model of passive fillers only.
CONCLUSION
This paper provided an internally-consistent multi-physics modelling approach for the systematic benchmarking of five environmentally friendly nanofillers (ZnO, TiO₂, halloysite clay, graphene oxide, and cellulose nanocrystals) in a waterborne epoxy coating for mild steel corrosion protection. The following novel aspects of this work are now highlighted. Firstly, a fully-consistent simulation framework unifying the Cussler tortuous-path model, Butler–Volmer kinetics, two-time-constant CPE-based EIS, and an agglomeration-penalised PE model was presented and validated to objectively compare different fillers using the same modelling assumptions for the first time. Secondly, material-specific CPE exponents and double-layer capacitance parameters were appropriately selected to resolve experimentally unique electrochemical signatures for each nanofiller, separating the individual Nyquist, Bode magnitude, and phase-angle plots which could not be discriminated by a generalised model. Thirdly, a set of meaningful upper-loading thresholds was identified for all five fillers based on mechanistic agglomeration modelling, giving practical formulation guidelines spanning 5.0 vol% (GO) to 14.5 vol% (CNC). Fourthly, model predictions were compared against available literature within ±10% for four of the five systems, with the discrepancy for CNC being traced back to the passive-only modelling approach. Graphene oxide (GO) was identified as the best electrochemical performer (77.2% PE, 0.0265 mpy), while halloysite clay was found to offer the most industrially attractive compromise of PE, environmental-friendliness, and robustness in coating formulation, and therefore recommended as the leading candidate for sustainable anticorrosion coatings.
CONFLICT OF INTEREST
The authors declare that there is no conflict of interests regarding the publication of this manuscript.
